Atlas · Spatial biology
Who is doing spatial biology, and with what
Spatial biology papers mapped to the lab behind each one, with the platform it used and the core facilities that offer it. Each paper links to its source.
What the data shows
Spatial omics papers more than doubled in two years: 815 in 2023, 2,011 in 2025.
Basis: papers using a spatial omics platform (sequencing, imaging RNA, high-plex protein, GeoMx or mass-spec imaging), by publication year. Targeted stains such as RNAscope are excluded. 2026 had 1,181 by October.
Visium is still the workhorse, but imaging platforms are growing fastest.
| Platform | 2023 | 2024 | 2025 |
|---|---|---|---|
| Visium | 307 | 508 | 737 |
| Xenium | 19 | 65 | 223 |
| CosMx | 20 | 42 | 107 |
| Visium HD | 2 | 16 | 94 |
Basis: papers using the platform, by publication year. A paper using two platforms counts under both.
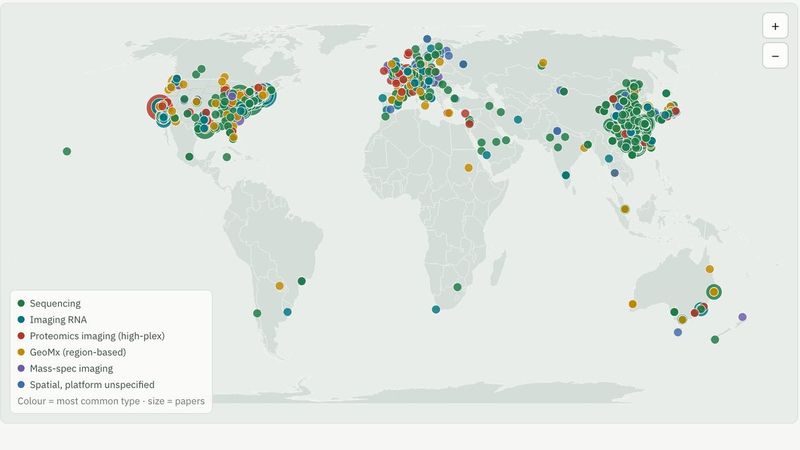
The US and China produce two thirds of spatial omics papers: 2,549 and 1,641 of 6,168.
Basis: country of each paper's lab, all years. Next are the United Kingdom (279), Germany (271), Australia (150) and Japan (142).
Leading institutions
| Institution | City | Spatial omics papers |
|---|---|---|
| Stanford University | Stanford | 107 |
| Johns Hopkins University | Baltimore | 97 |
| Broad Institute | Cambridge, MA | 97 |
| Chinese Academy of Medical Sciences & Peking Union Medical College | Beijing | 86 |
| MD Anderson Cancer Center | Houston | 75 |
Basis: papers led by a lab at the institution. The atlas lists every investigator behind these counts, the platforms they use and the core labs on site.
How it is built
Sourced from public registries, papers, regulatory filings and announcements; merged and mapped.
View the full atlas. The map, every lab and investigator, the platforms they use and the core facilities near them, with the source for each. Access is free for eligible users and requires registration.
Get access