Atlas · Gene therapy
Who is doing what in gene therapy
A map of gene therapy trials worldwide, the vectors and editors behind them, the centers that run them, what has been approved, and 8,700 recent papers. Each record links to its primary source.
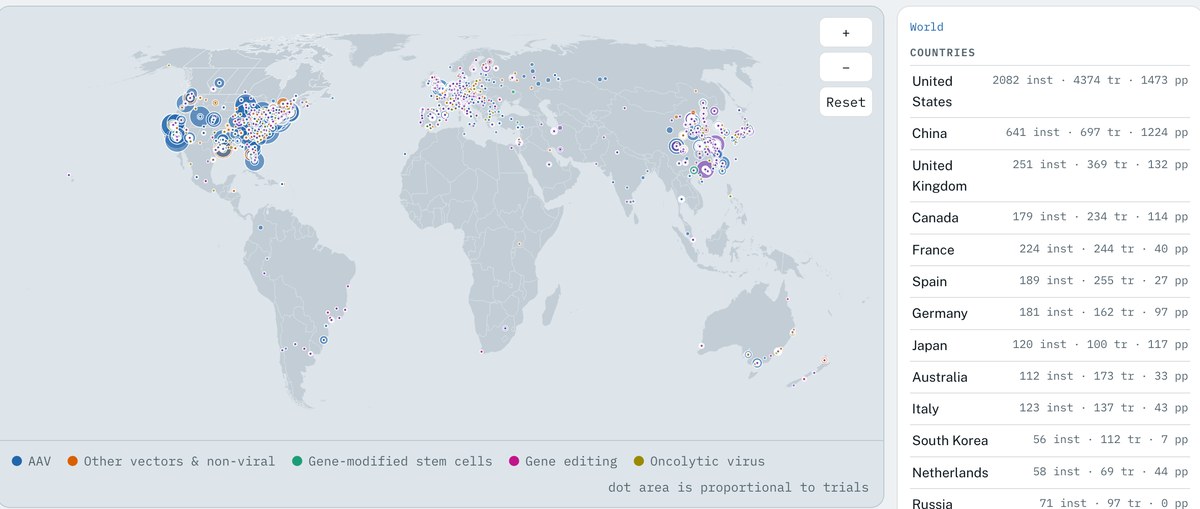
What the data shows
Gene therapy is American in a way cell therapy is not. The United States has a site in 896 gene therapy trials, China in 345. In cell therapy that order is reversed.
Basis: trials with at least one site in the country, counted once per trial. The next four are the United Kingdom (180), Canada (122), France (109) and Germany.
Approvals arrived in a rush. Three gene therapy products were approved from 2015 to 2019, four from 2020 to 2022, and sixteen since 2023.
Basis: FDA-approved cellular and gene therapy products, by approval date. The sixteen since 2023 are more than the previous twenty years combined.
AAV is the workhorse: 564 trials, more than any other vector class. Within it, AAV9 leads the published work with 615 papers against AAV2's 301.
Basis: trials by vector class, each counted once. Capsid counts come from the papers' own methods, with pseudotyped constructs such as AAV2/9 attributed to the capsid, not the genome.
| Vector class | Trials |
|---|---|
| AAV | 564 |
| Other vectors and non-viral | 428 |
| Oncolytic virus | 366 |
| Gene-modified stem cells | 214 |
| Gene editing | 115 |
Gene editing went from nothing to a standing modality in a decade: no trials registered in 2015, 7 in 2020, 15 in 2025.
Basis: trials by year first registered. Over the same period AAV went from 19 to 51 and oncolytic viruses from 10 to 26.
Rare and genetic disease is nearly as large as oncology here, which is not true anywhere else in therapeutics: 635 oncology trials against 444 rare and genetic, then blood disorders (166) and neurology (142).
Basis: the primary indication recorded on each trial.
Leading centers
| Center | City | Trials |
|---|---|---|
| Duke University | Durham | 78 |
| UCLA | Los Angeles | 77 |
| UC San Diego | San Diego | 69 |
| Northwestern University | Chicago | 68 |
| Mayo Clinic | Rochester | 62 |
Trials listing the center as a site. Spelling variants of one institution are counted once.
Why we made a separate gene therapy and cell therapy atlas. Most industry reports put cell and gene therapy in one bucket, and for an overall market-size number that is reasonable. For finding who does what, it makes it a bit more difficult to view trends and uncover who is doing what.
They are two research communities. Of 35,472 identified researchers across both fields, 367 work in both. That is one percent.
Secondly the methods share almost nothing: a CAR-T group's bench runs activation reagents and expansion systems, an AAV group's runs capsids, titering and packaging lines.
The one exception is in vivo cell therapy, where a vector is delivered and the cells are made inside the patient. Those trials are listed in both.
How it is built
Sourced from public registries, papers, regulatory filings and announcements; merged and mapped.
View the full atlas. The map, every trial, center, company and paper, and the readouts by vector, target, stage and evidence. Access is currently invite only.
Request access